Relationship of Temperature and Energy Demand
The natural inclination of humans to seek comfort plays a pivotal role in shaping our energy usage patterns, with temperature exerting a substantial influence. When temperatures dip below a certain threshold, our inclination prompts us to resort to heaters in order to maintain a cozy atmosphere. Conversely, when temperatures exceed a certain upper limit, the preference shifts towards utilizing air conditioning units to ensure a cool environment.
Although individuals might gradually build tolerance to hot and cold weather, there comes a point where our impulse to regulate the surroundings takes precedence. An intrinsic desire for comfort and well-being drives this tendency to control the ambient temperature. As we strive for optimal conditions, we engage with technologies that allow us to fine-tune our surroundings, thereby emphasizing the significance of temperature in our energy consumption behaviors.
Regional Maximum Temperature and Maximum Energy Demand
The graphs below show the relationship between the maximum temperature and maximum energy demand within the 10 Electric Power Company jurisdictions in Japan.
The energy demand data was directly taken from the Electric Power Companies (EPCOs), while the temperature data was based on the major city for each of the 47 prefectures in Japan. The cities’ temperature within the EPCOs’ jurisdictions were used to calculate the population-based weighted average of their respective regions.
The two inflection points are identified by fitting the scattered data points using scipy and a 3-segment piecewise function. The data points were fitted using the 3-segment piecewise function based on initial data analysis that shows three regions: heating, no environmental control, and cooling. nd
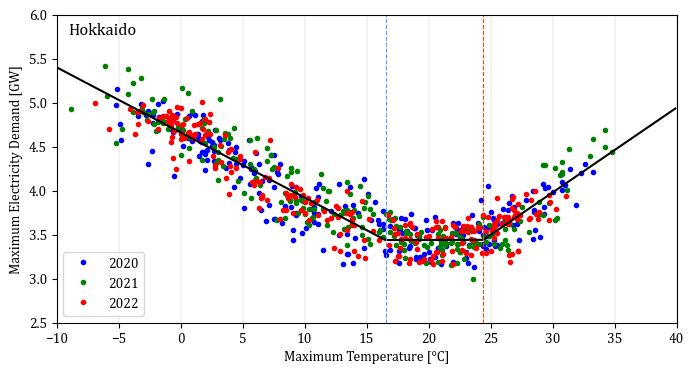
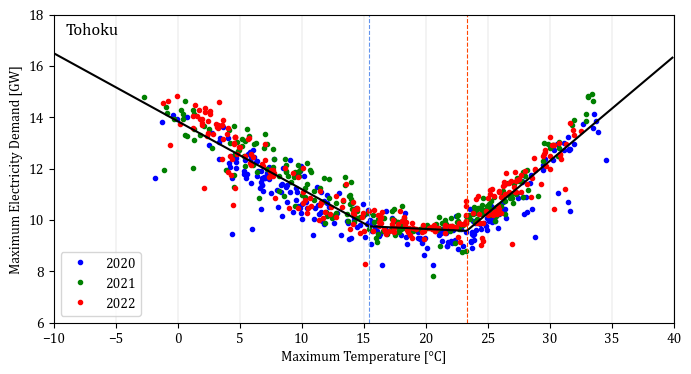
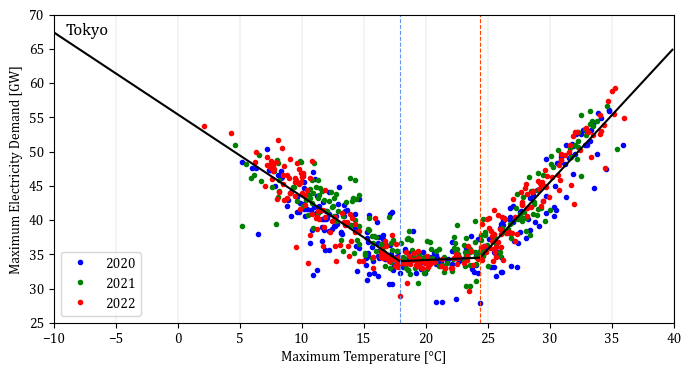
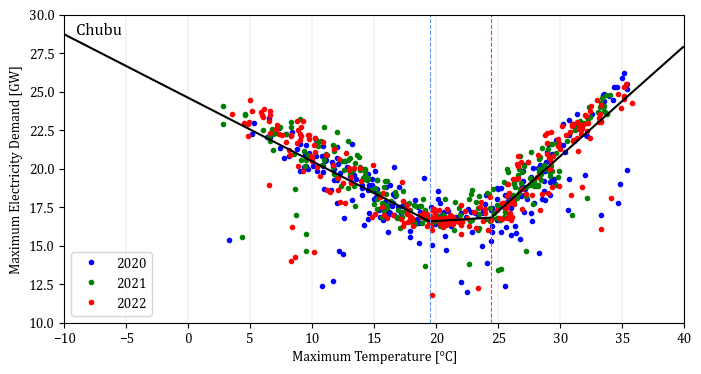
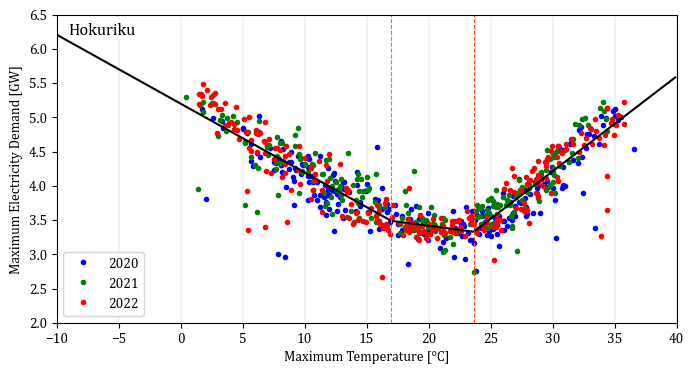
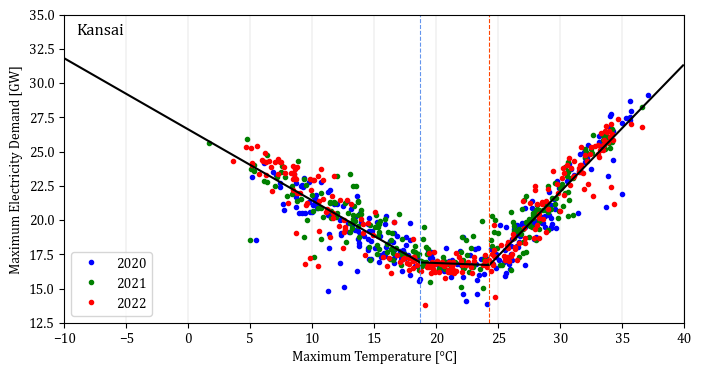
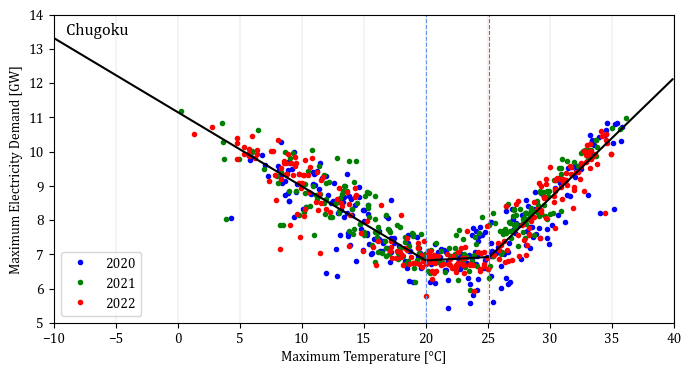
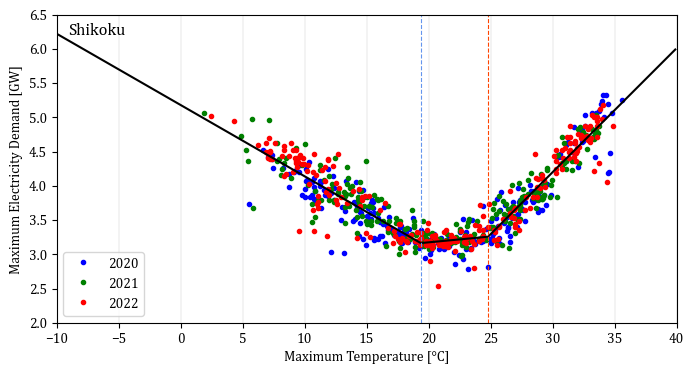
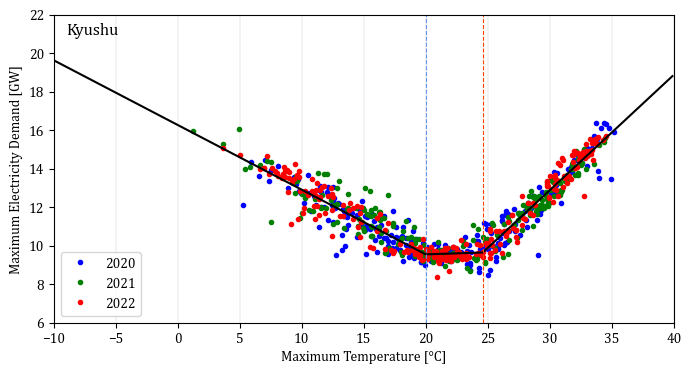
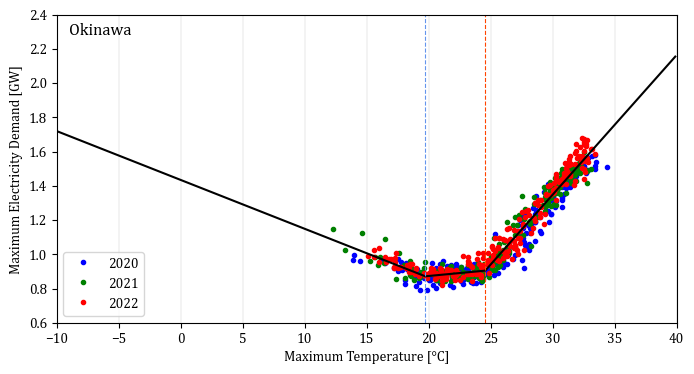
The inflection points are tabulated below. Ideally, we want the cold inflection point to be as long as possible and the hot inflection point as high as possible. Combined, we can identify the comfortability range with the least energy demand.
| cold | hot | range | |
|---|---|---|---|
| hokkaido | 16.53 | 24.42 | 7.89 |
| tohoku | 15.46 | 23.31 | 7.85 |
| tokyo | 17.91 | 24.39 | 6.48 |
| chubu | 19.46 | 24.42 | 4.96 |
| hokuriku | 16.99 | 23.65 | 6.66 |
| kansai | 18.69 | 24.27 | 5.58 |
| chugoku | 20.00 | 25.13 | 5.13 |
| shikoku | 19.37 | 24.80 | 5.42 |
| kyushu | 20.00 | 24.60 | 4.60 |
| okinawa | 19.74 | 24.57 | 4.83 |
The results showed that the northern regions have a high comfortability range mainly due to their higher tolerance to cold weather. The table below is sorted based on the cold inflection point. Tohoku, Hokkaido, and Hokuriku rank high in cold tolerance.
| cold | hot | range | |
|---|---|---|---|
| tohoku | 15.46 | 23.31 | 7.85 |
| hokkaido | 16.53 | 24.42 | 7.89 |
| hokuriku | 16.99 | 23.65 | 6.66 |
| tokyo | 17.91 | 24.39 | 6.48 |
| kansai | 18.69 | 24.27 | 5.58 |
| shikoku | 19.37 | 24.80 | 5.42 |
| chubu | 19.46 | 24.42 | 4.96 |
| okinawa | 19.74 | 24.57 | 4.83 |
| kyushu | 20.00 | 24.60 | 4.60 |
| chugoku | 20.00 | 25.13 | 5.13 |
The table below is sorted based on the hot inflection point in descending order. The southern regions have a higher tolerance to warmer weather. Chugoku, Shikoku, and Kyushu rank high in hot tolerance.
| cold | hot | range | |
|---|---|---|---|
| chugoku | 20.00 | 25.13 | 5.13 |
| shikoku | 19.37 | 24.80 | 5.42 |
| kyushu | 20.00 | 24.60 | 4.60 |
| okinawa | 19.74 | 24.57 | 4.83 |
| hokkaido | 16.53 | 24.42 | 7.89 |
| chubu | 19.46 | 24.42 | 4.96 |
| tokyo | 17.91 | 24.39 | 6.48 |
| kansai | 18.69 | 24.27 | 5.58 |
| hokuriku | 16.99 | 23.65 | 6.66 |
| tohoku | 15.46 | 23.31 | 7.85 |
There could be social and technical issues that could explain these differences, but further information is necessary to identify the reasons. However, given the increasing global temperature, it is essential to explore this comfortability range since the efficiency of our environmental control technology is highly influenced by the difference between the outdoor temperature and our desired “comfortable” temperature. I think this inquiry merits further investigation.